
Client Project/Smart Buildings
Custom IFC Viewer with Live IoT Sensors for Building Operations in Dubai
A custom IFC/GLB building viewer on Mapbox with live IoT sensors, IAQ heatmaps, and an interactive AHU digital twin for facilities operations in Dubai.
Dubai, UAE
Custom IFC Viewer, IoT Devices, Digital Twin, Indoor Modeling
About the Project
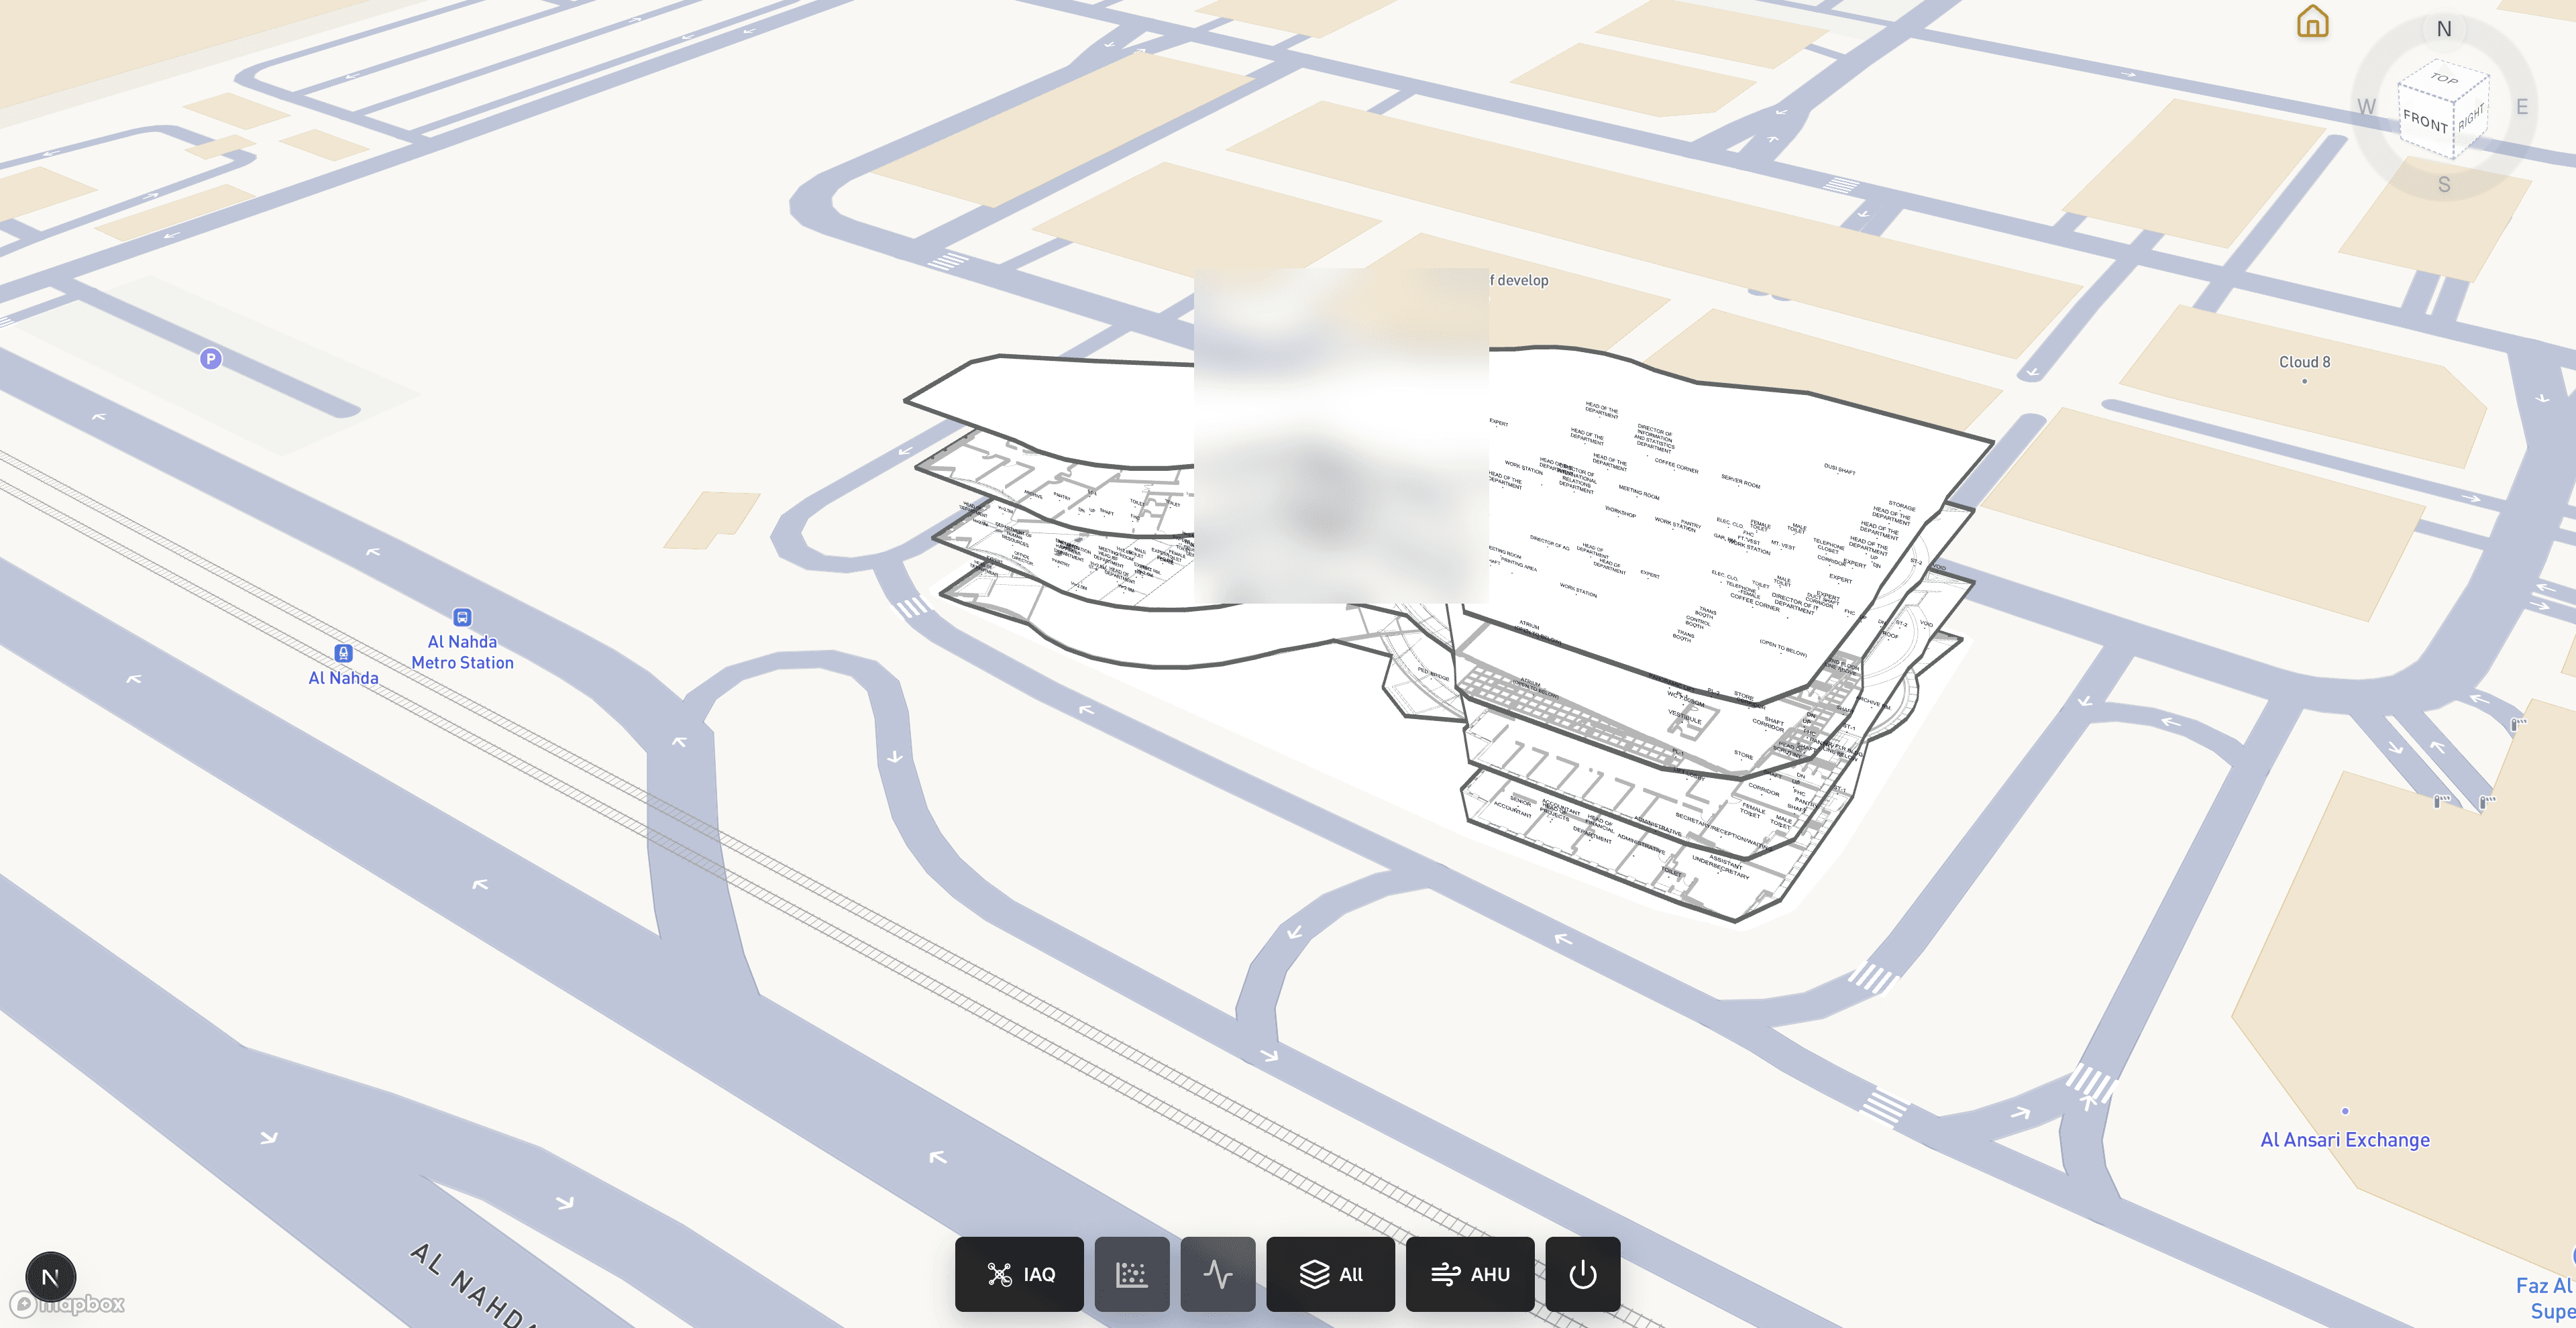
This workspace places a custom IFC-derived GLB floor model on Mapbox so operators can inspect rooms in real geographic context—not a disconnected desktop viewer.
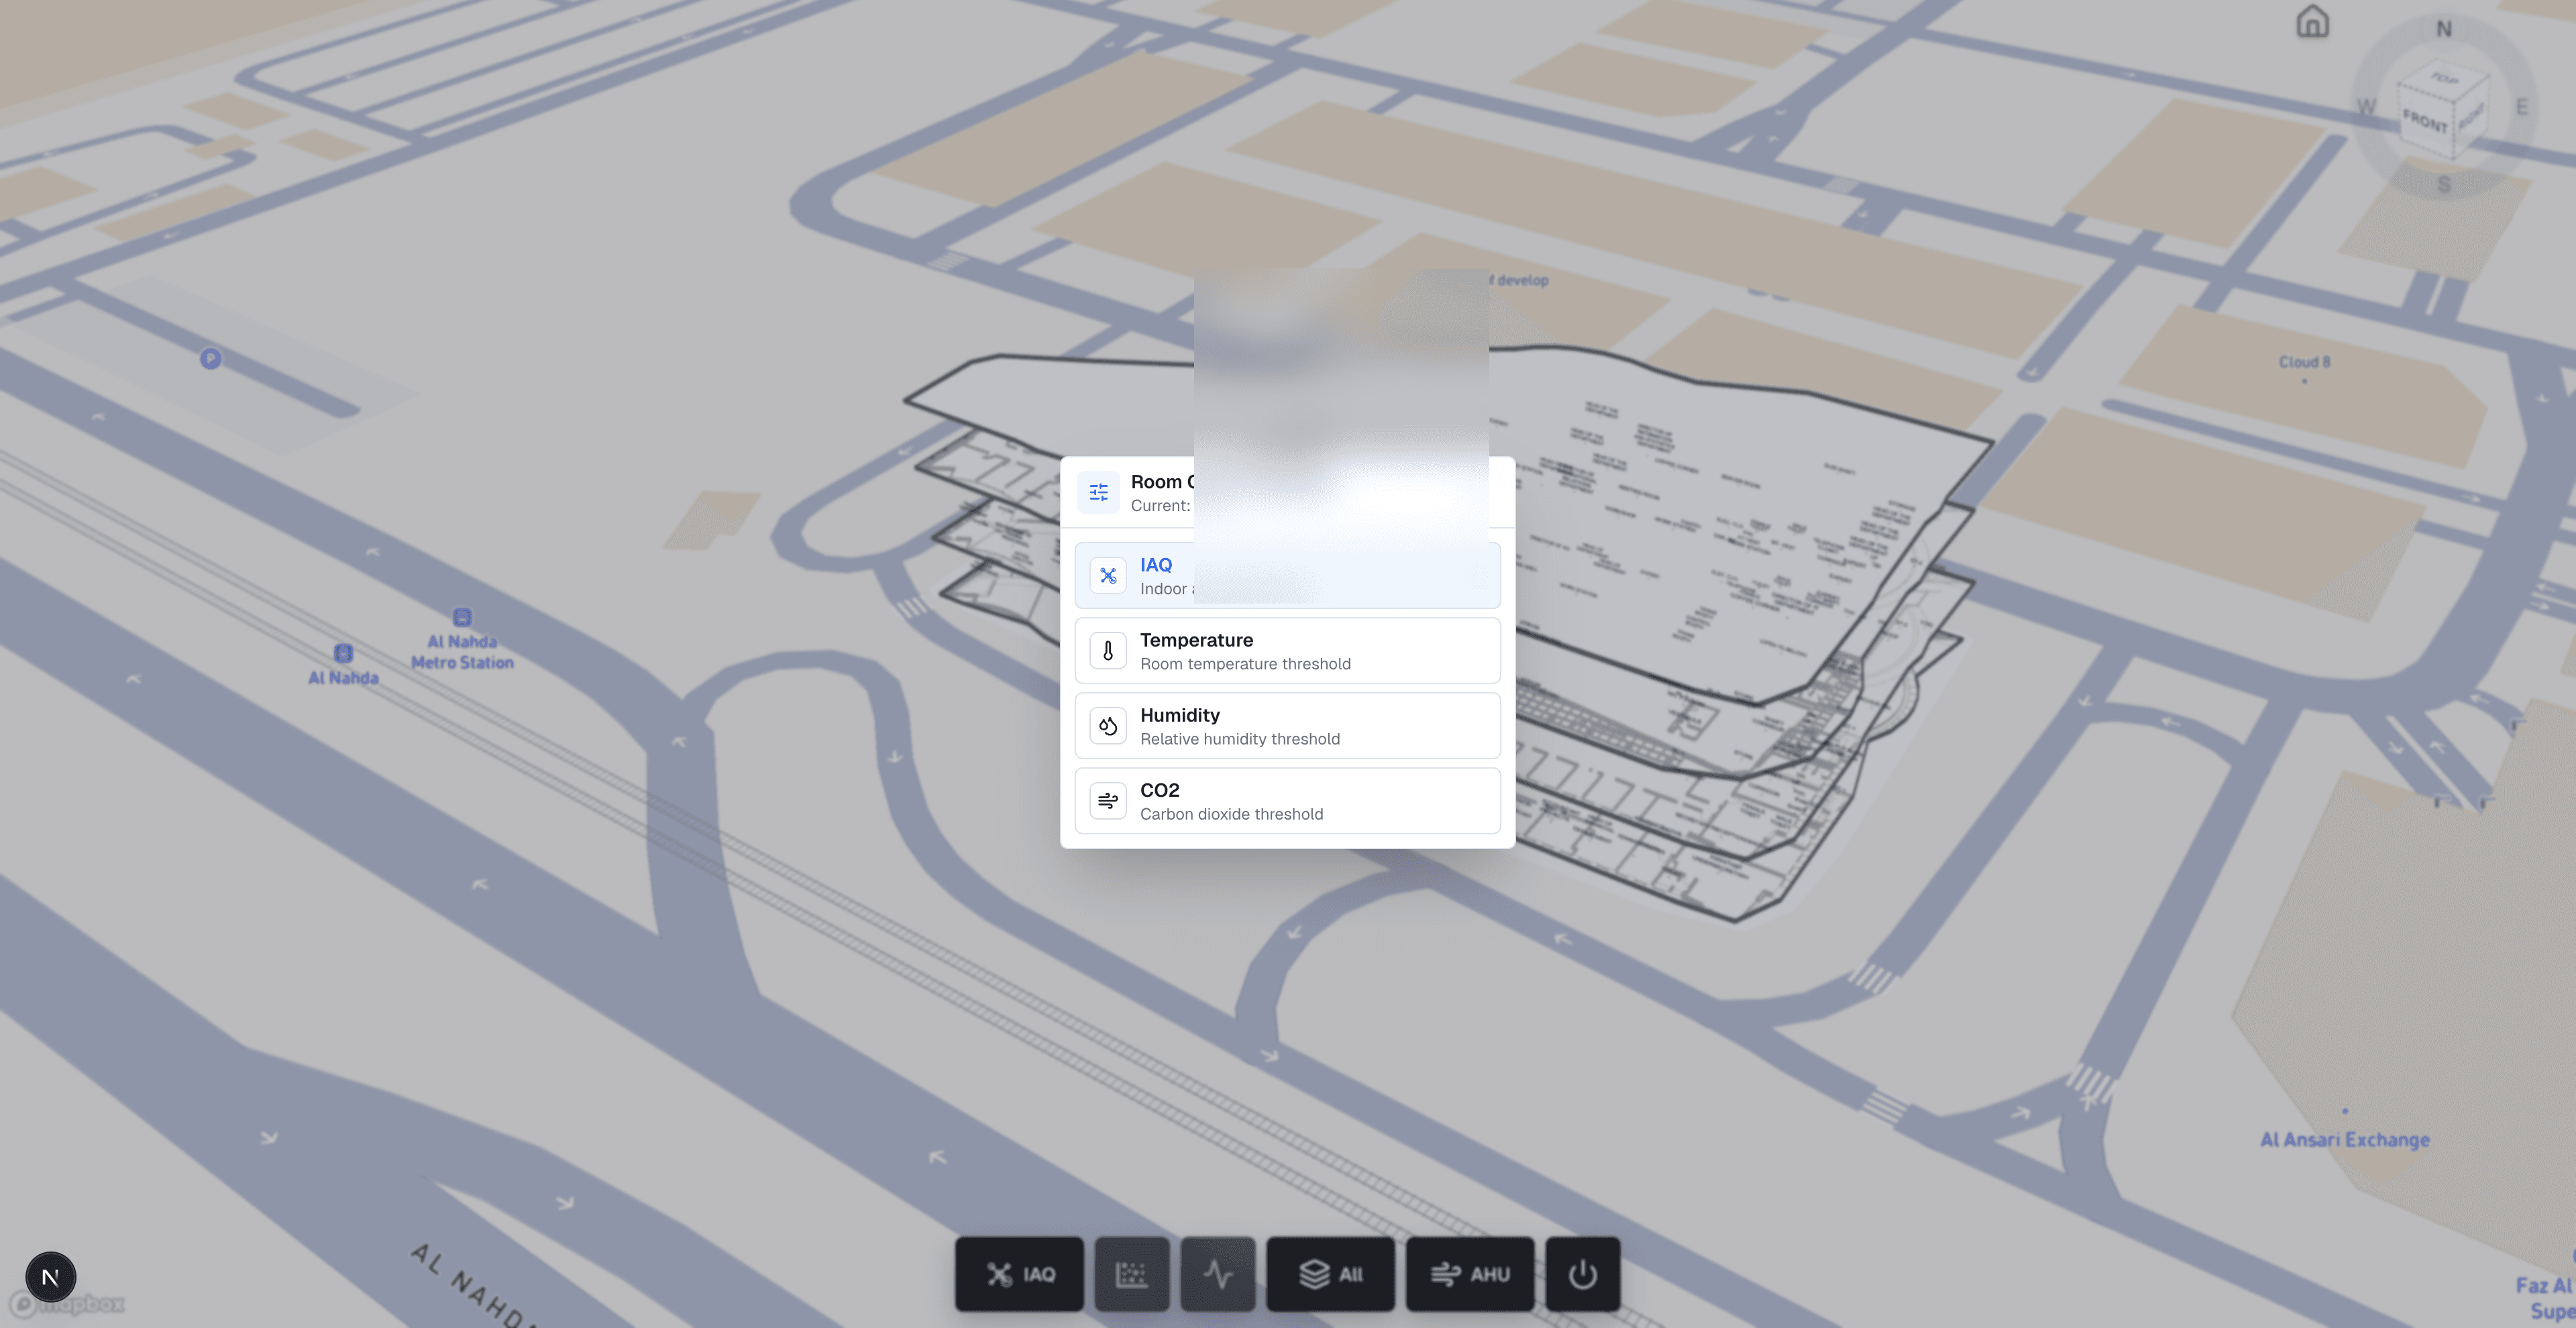
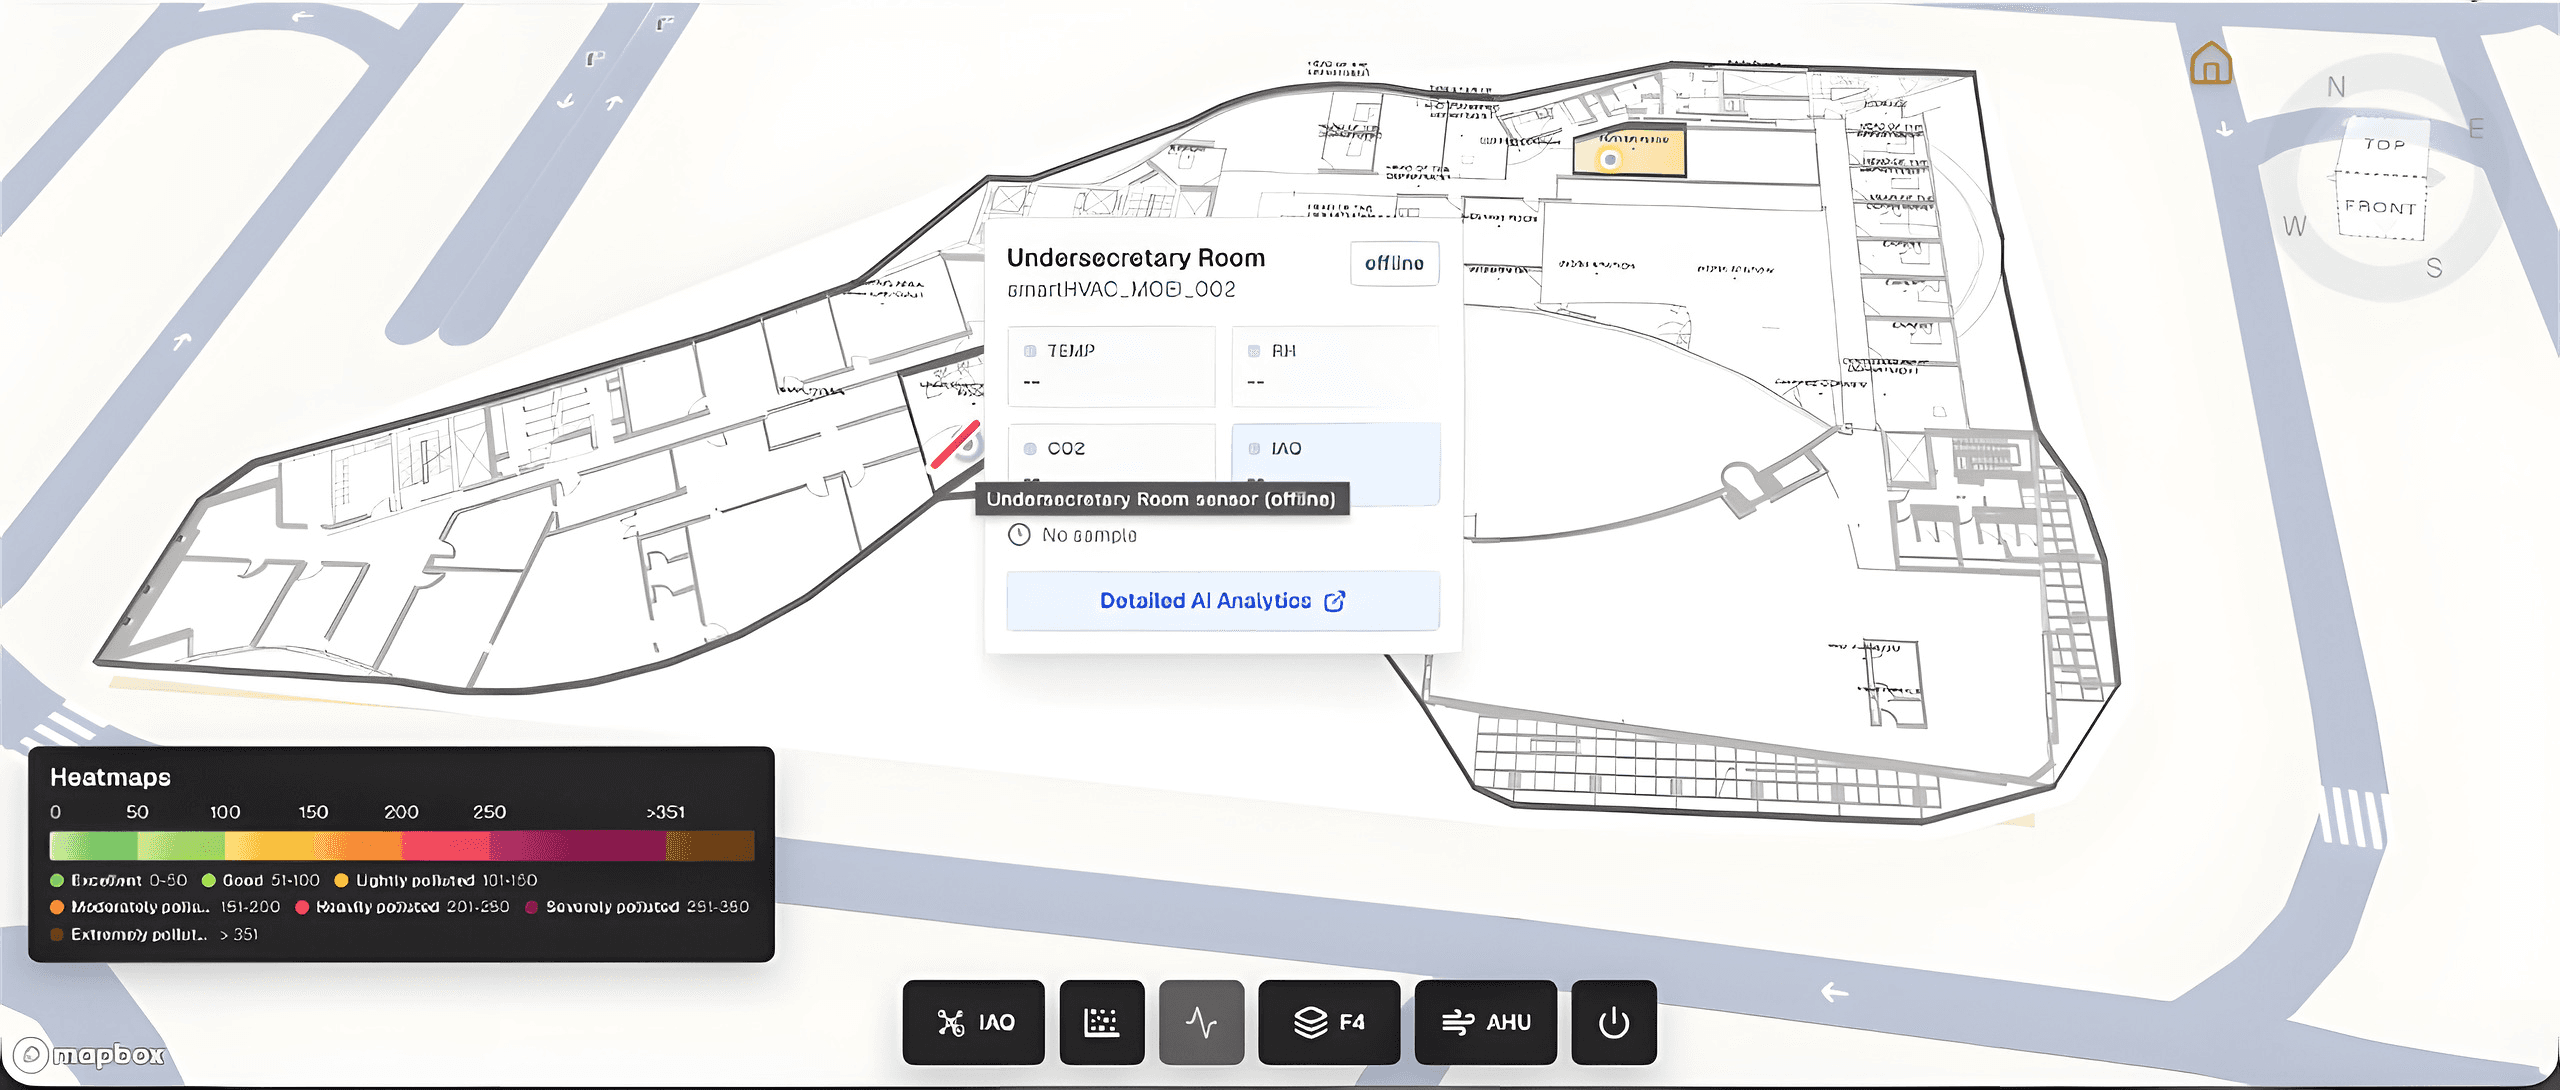
Installed smartHVAC IoT devices stream temperature, relative humidity, CO2, and IAQ into the model. Sensor markers show online/offline state, room fills reflect the active metric, and IAQ heatmaps make environmental risk readable floor by floor.
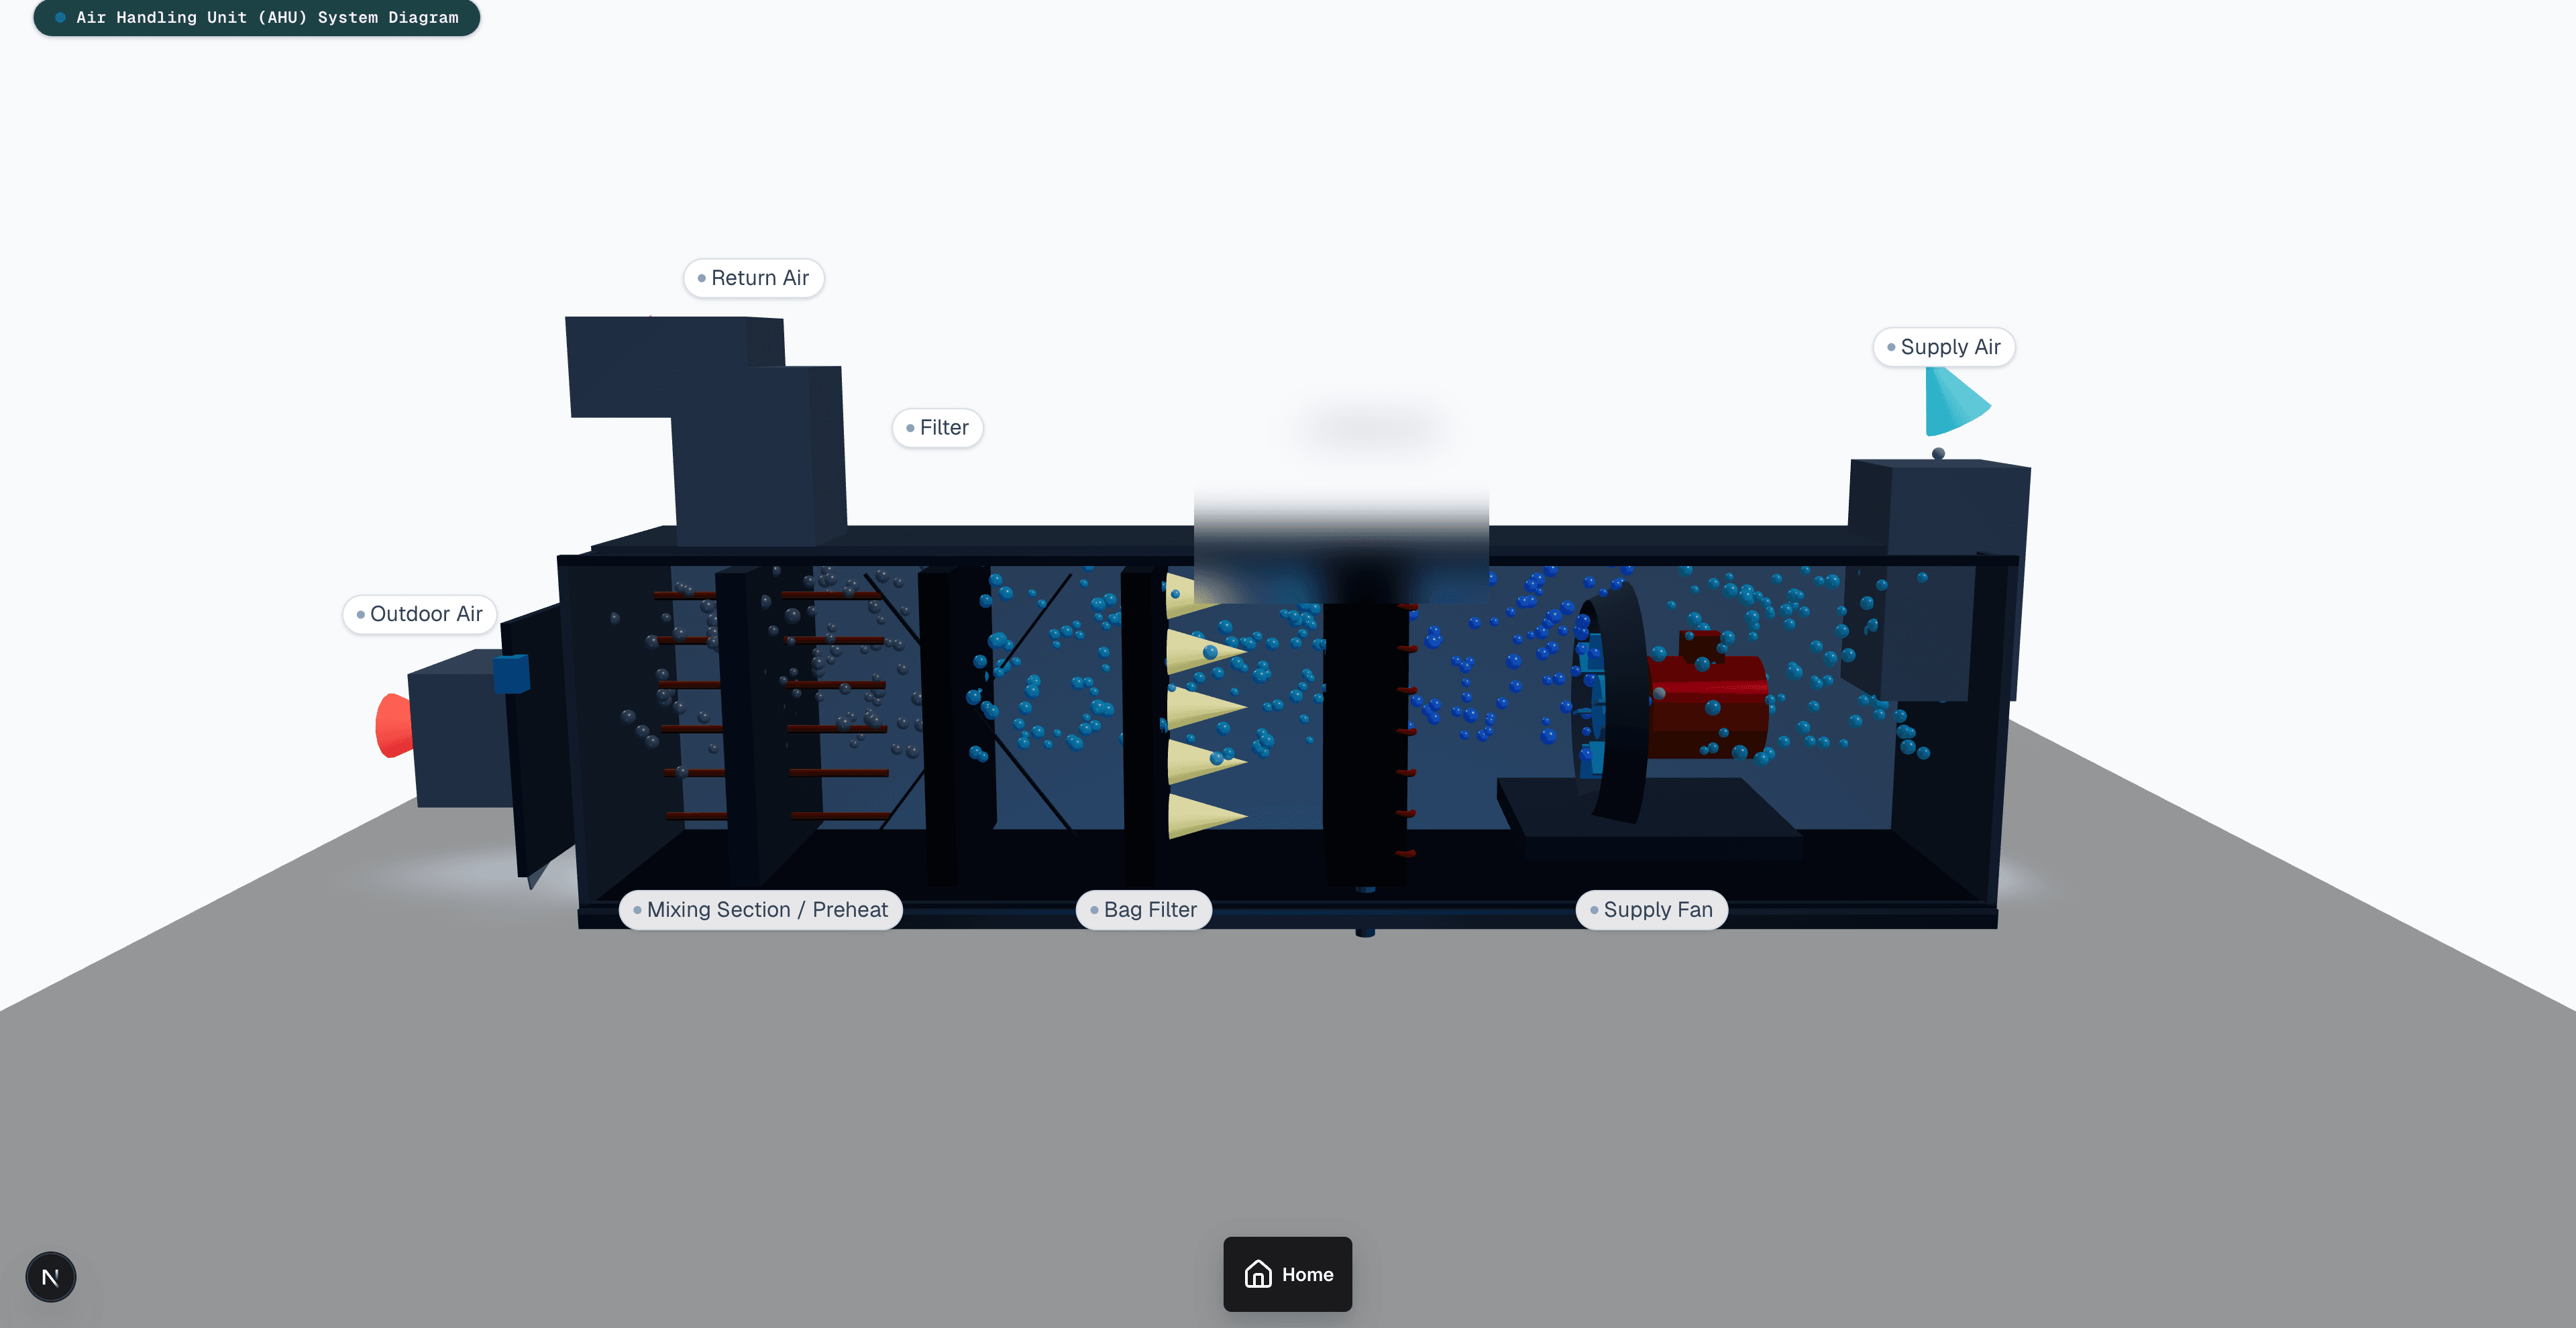
A dedicated AHU digital twin lets teams inspect filtration stages, coils, and fans with live metrics such as filter pressure drop, estimated life, and dust load—bridging spatial operations and mechanical system health in one browser experience.
Challenges We Faced
1. Anchoring indoor BIM geometry on a live map
The floor model had to stay georeferenced while panning, pitching, and switching Mapbox styles. That meant a custom Three.js layer sharing Mapbox’s WebGL context, plus calibration for origin, scale, rotation, and metre offsets.
2. Mapping installed IoT devices into rooms reliably
Each sensor needed a stable room mapping, live status, and metric coloring without overwhelming the map. Operators also needed clear offline states and links into deeper AI analytics dashboards.
3. Making mechanical systems operable, not just visible
Beyond room sensors, the delivery required an interactive AHU cutaway with labeled components, airflow cues, and health telemetry so facilities teams could diagnose filtration and HVAC condition in context.
How We Solved It
Built a Next.js App Router viewer with a Mapbox custom layer and Three.js/GLTFLoader to render the indoor GLB model in Mercator space.
Added live calibration controls for longitude, latitude, altitude, scale, rotation, and offsets so the model could be aligned to satellite imagery on site.
Connected InfluxDB for live and historical sensor streams, with SSE/live polling fallback and floor-aware room coloring for Temp, RH, CO2, and IAQ.
Placed sensor markers on room meshes with online/offline indicators, hover telemetry, and deep links into smartHVAC analytics.
Delivered an interactive AHU scene with component selection, airflow particles, and live health panels for filtration and mechanical stages.
Project Screenshots
Results Delivered
Delivered a production building-operations viewer where facilities teams can inspect georeferenced indoor models, monitor installed IoT devices in place, and diagnose AHU component health without leaving the browser.
Georeferenced IFC/GLB indoor models on Mapbox for facilities context
Live room IoT metrics and IAQ heatmaps in place on the model
Interactive AHU digital twin for component-level diagnosis
Offline and online sensor status visible without desktop tools
Technologies We Used
Next.jsReactTypeScriptMapbox GLThree.jsReact Three FiberInfluxDBZustand
Ready to Start?
Let's Build Something Great Together
Need a custom IFC viewer with IoT on your facilities? Explore how BimEx can connect models, sensors, and operations into one browser workspace.