
“Live feeds had to update the APS Viewer without slowing the model or burying the geometry under noise.”
BIM-IOT
The Challenge
Operators had sensors and a BIM viewer—but live readings, heatmaps, and history lived in separate tools outside the model.
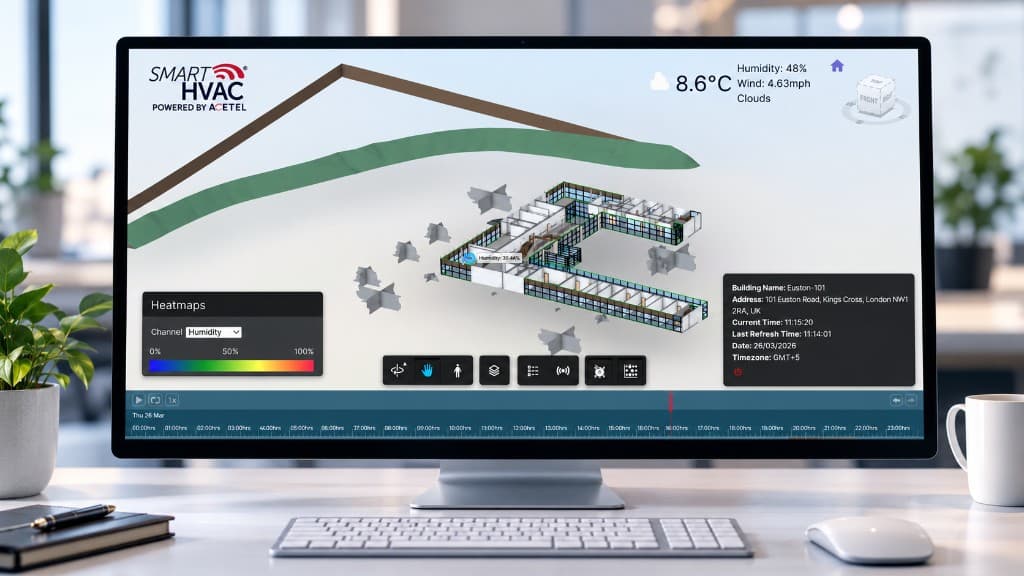
Building managers and operators see temperature, humidity, air quality, and related metrics in the same viewer they already use for model review—sensor markers and heatmaps give instant spatial context across the facility.
Clicking model elements opens sensor detail panels with live readings, while historical charts support trend analysis and building performance decisions.
Live feeds from multiple sensors had to update the APS Viewer experience in a way that stayed performant and readable while the full BIM model remained interactive.
Temperature, humidity, and air-quality data needed clear visual overlays on 3D elements without hiding geometry or overwhelming the operator.
Beyond live values, the system had to store, query, and chart historical readings so teams could spot patterns and optimize building performance over time.
Solution
BimEx connected InfluxDB streams to APS Viewer overlays so installed devices, heatmaps, and trends appear where the building already lives.
Integrated Autodesk Platform Services for browser-based 3D BIM viewing and element interaction.
Connected InfluxDB for real-time IoT ingestion and historical storage of sensor readings.
Built custom heatmap extensions that overlay sensor metrics directly on model elements.
Added interactive dashboards with historical charts and trend visualizations.
Shipped sensor detail panels that surface live readings when operators select model elements.
The Outcome
Results Delivered
Delivered an APS Viewer experience where installed IoT devices appear in model context—with live overlays, heatmaps, and historical analytics for smarter building operations.
Installed IoT devices appear on APS model geometry in context Live overlays and heatmaps support spatial monitoring Historical analytics stay tied to spaces and equipment Operators review status without leaving the browser viewer
Live IoT overlay
On APS model geometry
Heatmaps
Spatial environmental view
Historical trends
Tied to spaces and assets
“Live feeds had to update the APS Viewer without slowing the model or burying the geometry under noise.”
Conclusion
The building already had a digital twin. It needed a live nervous system on top of it.
BIM-IOT closes the gap between facility telemetry and model context. When operators can click an element and see live readings—or scan a heatmap across a floor—they stop translating between dashboards and drawings by hand.
That is the same pattern as any operations stack where structured systems sit downstream of streaming inputs: remove the human translation layer, and judgment moves back to decisions that actually need people.